This is a section that I'll update as I learn more about the space, since I'm studying differential geometry over the summer, I hope to know enough about "sympletic manifolds". I'll make this an append-only log to add to the section as I understand more.
§ 31st May
- To perform hamiltonian monte carlo, we use the hamiltonian and its derivatives to provide a momentum to our proposal distribution --- That is, when we choose a new point from the current point, our probability distribution for the new point is influenced by our current momentum.
- For some integral necessary within this scheme, Euler integration doesn't cut it since the error diverges to infinity
- Hence, we need an integrator that guarantees that the energy of out system is conserved. Enter the leapfrog integrator. This integrator is also time reversible -- We can run it forward for
nsteps, and then run it backward fornsteps to arrive at the same state. Now I finally know how Braid was implemented, something that bugged the hell out of 9th grade me when I tried to implement Braid-like physics in my engine!
- The actual derivation of the integrator uses Lie algebras, Sympletic geometry, and other diffgeo ideas, which is great, because it gives me motivation to study differential geometry
:)
- Original paper: Construction of higher order sympletic integrators
§ Simulating orbits with large timesteps
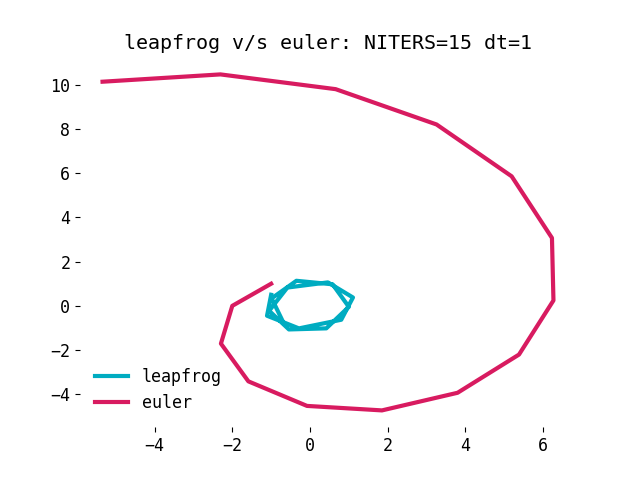
Clearly, the leapfrog integrator preserves energy and continues to move in an orbit, while the euler integrator goes batshit and causes orbits to spiral outwards. Full code is available below. More of the code is spent coaxing matplotlib to look nice, than doing the actual computation.
import numpy as npimport matplotlib.pyplot as pltimport numpy.linalg# dq/dt = dH/dp | dp/dt = -dH/dq (a = -del V)def leapfroge(dhdp, dhdq, q, p, dt): p += -dhdq(q, p) * 0.5 * dt # halfstep momentum q += dhdp(q, p) * dt # fullstep position p += -dhdq(q, p) * 0.5 * dt # halfstep momentum return (q, p)def euler(dhdp, dhdq, q, p, dt): pnew = p + -dhdq(q, p) * dt qnew = q + dhdp(q, p) * dtdef planet(integrator, n, dt): STRENGTH = 0.5 q = np.array([0.0, 1.0]); p = np.array([-1.0, 0.0]) # H = STRENGTH * |q| (potential) + p^2/2 (kinetic) def H(qcur, pcur): return STRENGTH * np.linalg.norm(q) + np.dot(p, p) / 2 def dhdp(qcur, pcur): return p def dhdq(qcur, pcur): return STRENGTH * 2 * q / np.linalg.norm(q) qs = [] for i in range(n): (q, p) = integrator(dhdp, dhdq, q, p, dt) qs.append(q.copy()) return np.asarray(qs)NITERS = 15TIMESTEP = 1plt.rcParams.update({'font.size': 22, 'font.family':'monospace'})fig, ax = plt.subplots()planet_leapfrog = planet(leapfroge, NITERS, TIMESTEP)ax.plot(planet_leapfrog[:, 0], planet_leapfrog[:, 1], label='leapfrog', linewidth=3, color='#00ACC1')planet_euler = planet(euler, NITERS, TIMESTEP)ax.plot(planet_euler[:, 0], planet_euler[:, 1], label='euler', linewidth=3, color='#D81B60')legend = plt.legend(frameon=False)ax.set_title("leapfrog v/s euler: NITERS=%s dt=%s" % (NITERS, TIMESTEP))ax.spines['top'].set_visible(False)ax.spines['right'].set_visible(False)ax.spines['bottom'].set_visible(False)ax.spines['left'].set_visible(False)plt.show()plt.savefig("leapfrog-vs-euler.png")